


Page 30 - gs260702
P. 30
Insights and Expertise


                                                              What your merchant


                                                              services portfolio is


                                                              really worth – Part 2


                                                              By George Csahiouni
                                                              Tripoli Advisors

              n the first article of this two-part series, I discussed several factors shaping merchant portfolio valuations, includ-
              ing attrition, merchant concentration risk, revenue per merchant, agent compensation, technology entrenchment
              and processor relationship diversity. This installment explains how portfolios are currently being valued. Portfolio
        I valuations in today's market are typically expressed as multiples of monthly net residual income, adjusted for the
        quality factors described in Part 1 of this series. If you want to review that article, you'll find it in The Green Sheet issue
        26:06:02 at https://www.greensheet.com/emagazine.php?article_id=8232.

        Most ISO owners and agents think in terms of monthly multiples—"my portfolio is worth 24x"—so that is how I will
        frame it here.An important clarification: the valuation ranges that follow reflect the realistic market for individual agent
        portfolios and small to midsize ISO portfolios—the types of books that are most commonly bought, sold and financed in
        the merchant services ecosystem. These are not the same multiples that large FSPs (Fiserv Service Providers), wholesale
        ISOs, or aggregated platforms command. Agents and ISO owners frequently hear about headline multiples of 40x, 50x
        or higher and assume that is what their portfolio should be worth, but those numbers are typically achieved through
        aggregation, institutional scale, diversified infrastructure and multi-year track records that individual agents and small
        ISOs have not yet built. Understanding where your portfolio sits in the market, not where the largest platforms sit, is the
        starting point for any realistic valuation conversation.

        In practice, valuations fall into three scenarios depending on the transaction structure: a static run-off sale (no future
        originations included), a go-forward sale (seller continues originating new merchants exclusively for the buyer), and a
        hybrid structure that falls somewhere in between.

        Static run-off sale
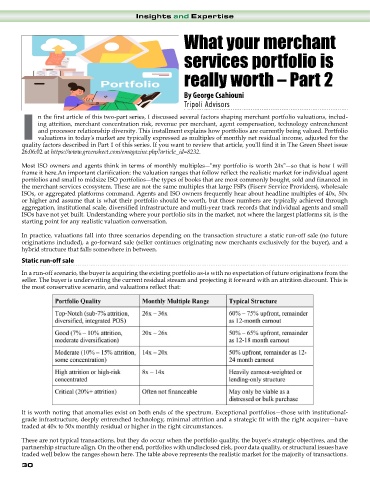
        In a run-off scenario, the buyer is acquiring the existing portfolio as-is with no expectation of future originations from the
        seller. The buyer is underwriting the current residual stream and projecting it forward with an attrition discount. This is
        the most conservative scenario, and valuations reflect that:


        It is worth noting that anomalies exist on both ends of the spectrum. Exceptional portfolios—those with institutional-
        grade infrastructure, deeply entrenched technology, minimal attrition and a strategic fit with the right acquirer—have
        traded at 40x to 50x monthly residual or higher in the right circumstances.

        These are not typical transactions, but they do occur when the portfolio quality, the buyer's strategic objectives, and the
        partnership structure align. On the other end, portfolios with undisclosed risk, poor data quality, or structural issues have
        traded well below the ranges shown here. The table above represents the realistic market for the majority of transactions.
        30

